This Blog was Originally Posted to Churnfree Blog
Winning new customers is more costly and retaining long-term customers with long-term subscription plans can be much more valuable. Fortunately, today’s companies have b2b SaaS benchmarks such as robust customer retention strategies and acquiring a new tool to help them keep old users and acquire new ones.
Let’s dive into everything you need about b2b SaaS benchmarks. As churn experts at Churnfree we enable you to understand why your users cancel their subscriptions and assist you in retaining them with personalized onboarding experiences—Collect a pack of tips, b2b benchmarks, and guidance to improve your churn rates.
Knowing the deep-down definition of churn rate and how it can become subtly uncertain to affect your business strategies is imperative.
First, let’s explain what we mean by “churn rate.”
The churn rate estimates the number of users who cancel their subscriptions within a specific period. It is a beneficial practice to calculate revenue lost from churned users.
SaaS churn rates are critical for a business’s long-term undertakings and overall performance.
Calculating SaaS Churn Rate
SaaS churn rate focuses on the number of users that leave your services monthly or annually. To measure the SaaS churn rate, you can divide the total number of churned users via the total number of users:
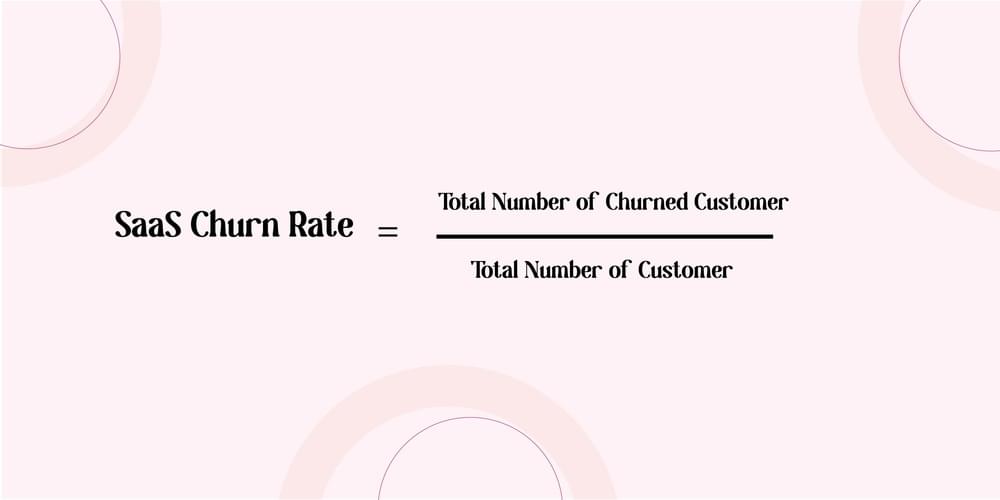
For example, if your business has 1000 customers and 80 ended their subscriptions last month, your customer churn rate is 8%. The SaaS churn rate is also understood as “logo churn.”
What is Churn rate in SaaS?
In the context of SaaS, the churn rate is a critical metric that measures the rate at which customers stop using the service over a specific period. It is an indicator of customer retention and business health.
The churn rate estimates the number of users who cancel their subscriptions within a specific period. It is a beneficial practice to calculate revenue lost from churned users.
SaaS churn rates are critical for a business’s long-term undertakings and overall performance.
Let’s dig into how to calculate saas churn rate and have a look at b2b saas benchmarks for 2024.
Net SaaS Churn Rate
To get more accurate measurements, there’s the net SaaS churn rate, which evaluates the number of new users your business gained over a specific period.
To measure it, you need to divide the total number of left users by the number of new users gained over a period via the total number of users.
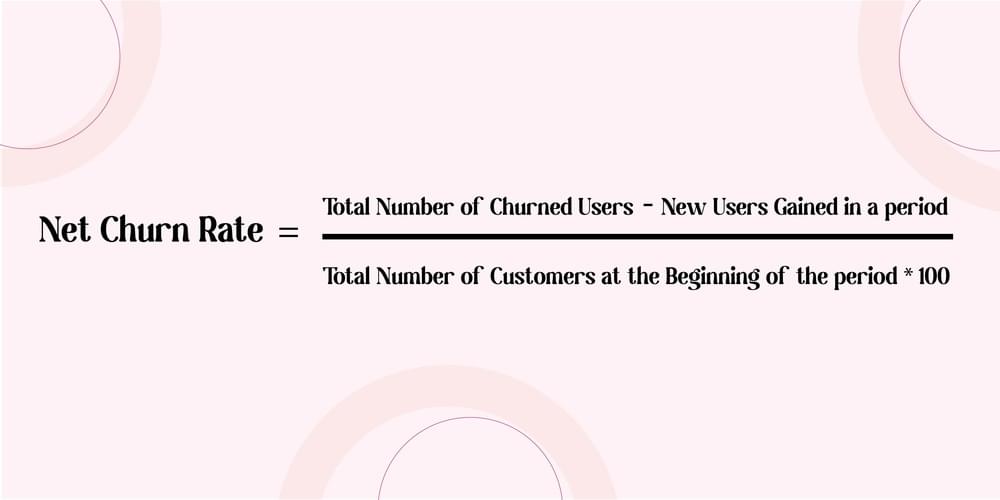
For example, if your company has 1000 customers, 80 of them canceled their subscription last month, while your business gained 2 new users, your net SaaS churn rate would be 6%.
Nevertheless, customer retention is a tremendous metric to evaluate your customer base and product experience. Still, it does not offer real insights into the revenue affected by the churned users—it’s usually connected with the revenue churn rate. The real insight is gained by the tool that measures your Net SaaS churn rate and helps you define your users’ behavior patterns.
Revenue Churn Rate
The revenue SaaS churn rate calculates the ratio of lost revenue due to some reasons, such as downgrades, cancellations, payment failures, and other bottlenecks. To measure it, you can divide the total churned revenue over a specific period with the total revenue at the beginning.
Calculating revenue churn rate benchmarks involves a similar process, focusing on the financial impact:
Determine Revenue at Start: Note the total revenue at the beginning of the period.
Assess Revenue Lost: Calculate the revenue lost due to customer churn during the period.
Compute the Rate: Divide the lost revenue by the starting total, then multiply by 100 for the percentage.
Example: If your starting revenue was $1 million and you lost $100,000 to churn, your revenue churn rate would be (100,000/1,000,000) * 100, equating to a 10% churn rate.
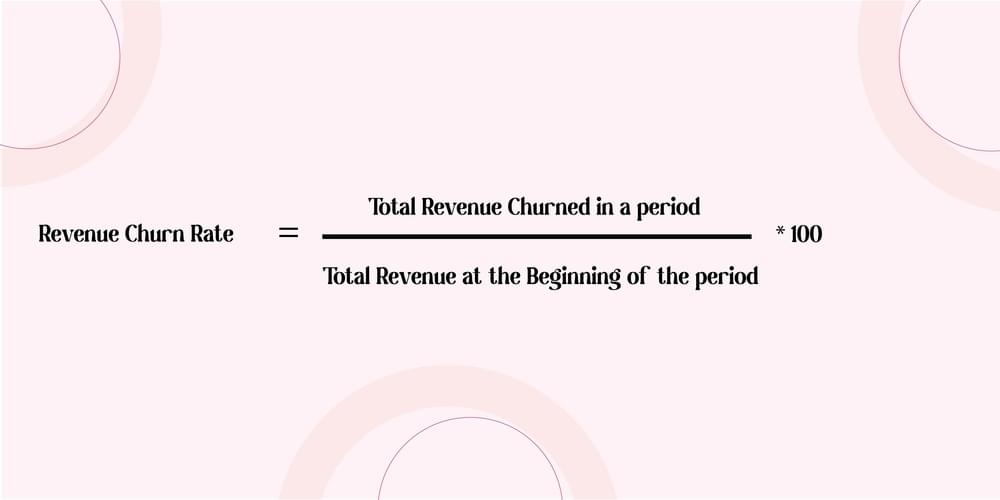
For instance, if your total revenue is $2,000 and your churned revenue is $300, your revenue churn rate will be 15%. The revenue churn rate helps set different pricing tiers for subscription pricing plans, which do not fall under the category of SaaS churn rate.
Net revenue churn rates give insight into the financial impact of customer departures. Smaller B2B SaaS companies often face a net revenue churn rate ranging from 10% to 15%. In contrast, larger companies usually maintain a healthier rate of about 5% to 7%. These figures are pivotal for assessing the overall financial health and sustainability of a company.
The net revenue churn measures the revenue obtained from expansion, such as upsells, add-ons, or tier upgrades. To measure it, you can divide the total churned revenue minus the expansion revenue by the total revenue at the beginning of the period. The very reason to calculate the revenue churn rate is to gain more in-depth insights into the actual revenue lost and gained.
For instance, if your business gained $2000 and your churned revenue is $300, but you also gained an additional $80 from expansion, and the net revenue churn is 7%.
Monthly Recurring Revenue/ Subscription Revenue
SaaS businesses usually operate on a monthly income basis. Therefore, another important metric to calculate when and why your customers decide to leave your services—is the Monthly Recurring Revenue (MRR) Churn. To measure average churn rate for subscription services, you can divide the total churned MRR minus the expanded MRR with the total MRR at the beginning of the month.
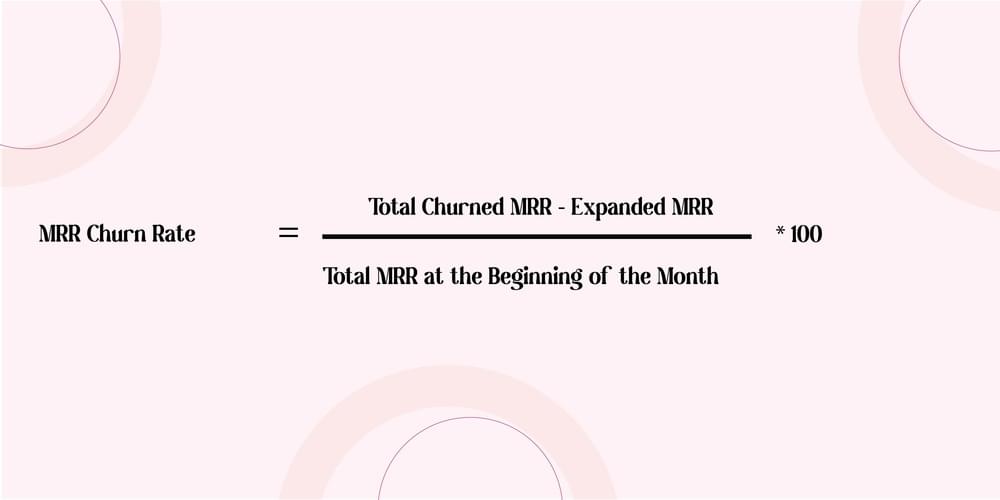
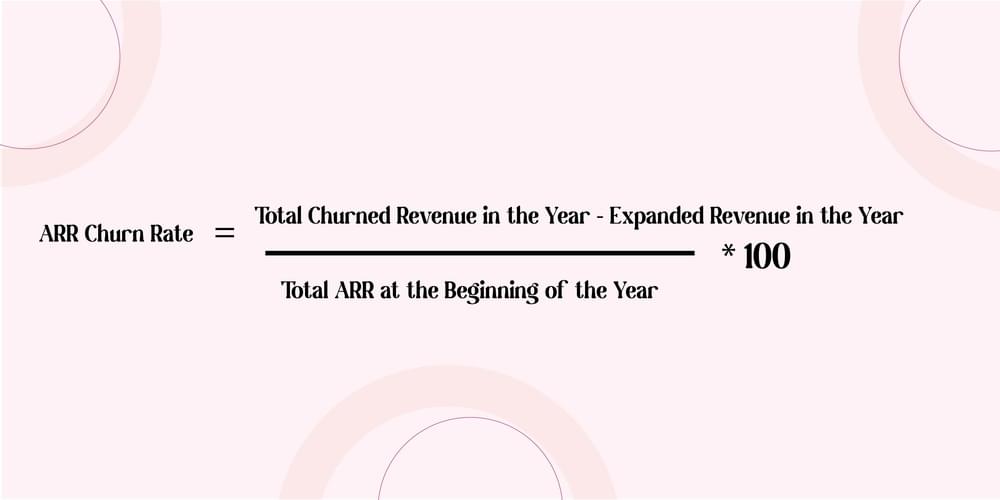
Likewise, you can know your Annual Recurring Revenue (ARR) churn if your business runs annually. Similarly, you can divide the total churned revenue minus the expanded revenue with the total ARR at the beginning of the year.
Similarly, you can estimate retention and measure Gross retention, Net retention, or Logo retention. Customer retention lets you track how successfully you can retain existing users happy and gain more revenue.
MRR and ARR metrics are essential for tracking the regular income generated from customers. For smaller companies, the gross MRR churn rate typically hovers around 2% to 2.5%, whereas larger companies manage to keep it at about 1%. Net MRR remains steady at 2% across most companies, reflecting a consistent revenue flow despite customer churn.
Monthly Churn Rate
For small to medium-sized SaaS businesses average SaaS churn rates revolve around 3% and 7%. On the other hand, around 1% is known to be ideal.
Annual Churn Rate
An annual churn rate of about 5% or less is essential for maintaining sustainable growth. It’s worth noting that larger companies typically experience lower churn rates due to their established market presence and the nature of their client contracts, which often include extended periods that limit churn.
The SaaS industry, on average, aims for an annual customer churn rate of 5% or lower for established companies. In contrast, the median gross dollar churn for SaaS companies stands at 12%, with a median annual logo churn of 13%, highlighting the challenges businesses face in minimizing revenue and customer losses year over year.
What is a good churn rate for SaaS?
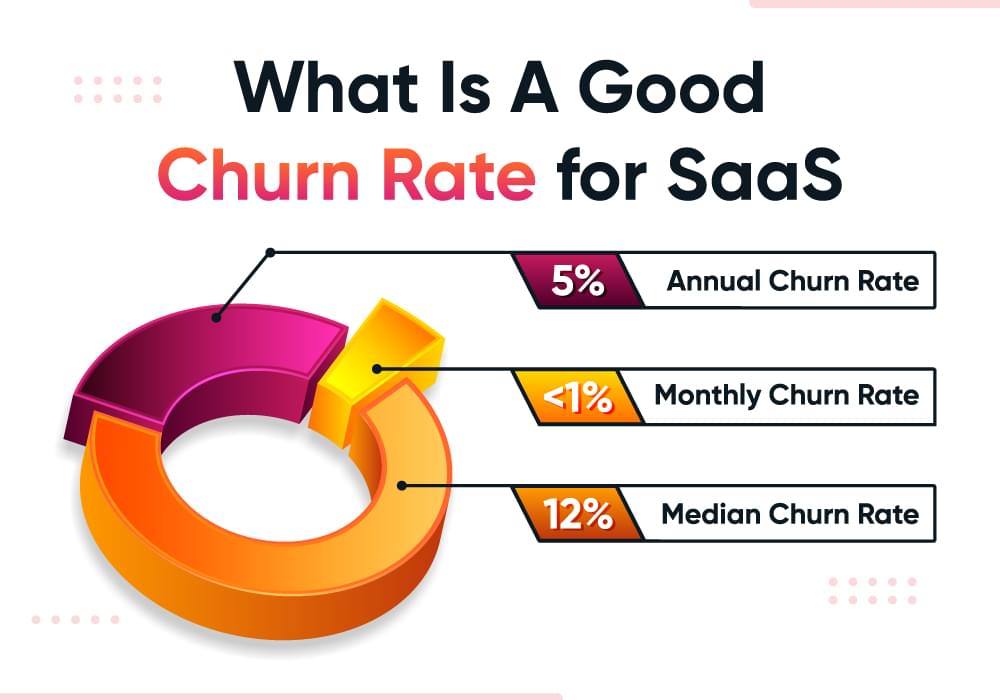
Around 5% annually is generally considered good and sustainable for SaaS companies, acceptable rates can vary depending on specific circumstances such as company size, market, and the nature of the SaaS product.
Annual Churn Rate: A sustainable churn rate for SaaS companies is often cited to be around 5% annually. This means that a company retains 95% of its customers over a year.
Monthly Churn Rate: For a monthly churn rate, a good benchmark is less than 1% per month, which translates to about 12% annually. Enterprises and larger companies typically have lower churn rates, closer to 0.5-1% monthly, while SMBs (small to medium-sized businesses) might see higher rates, around 3-7% monthly due to their different customer dynamics and shorter subscription cycles.
Industry Variation: Churn rates can vary significantly by industry and the specific type of SaaS product. For instance, B2B SaaS companies usually have lower churn rates compared to B2C SaaS companies because B2B relationships are often longer-term and more integrated into the client’s operations.
Median Churn Rates: According to surveys, the median annual gross dollar churn for SaaS companies is about 12%, and the median annual logo churn (the rate at which customers are lost) is approximately 13%. These figures provide a broader context for what might be considered typical across the industry.
Company size plays a crucial role in determining churn rates. Smaller companies, often newer in the market or with less established products, typically see higher churn rates, ranging from 3% to 7% annually. This is partly due to their customer base’s varying commitment levels and the lower financial barriers to switching services. Larger companies, with well-established products and more substantial contractual agreements, usually maintain lower churn rates of about 1% to 2% annually. These firms benefit from longer client relationships and often provide more comprehensive solutions that integrate deeply into their clients’ operations, making switching more cumbersome and less likely.
Factors Affecting Churn Rate Benchmarks in SaaS Companies
Voluntary vs. Involuntary Churn
1. Voluntary Churn: This occurs when customers decide to cancel their subscriptions, often due to dissatisfaction with the product or service. Common reasons include a lack of needed features, poor customer support, or a better offer from a competitor. The voluntary churn rate for B2B companies stands at 3.50%, slightly lower than B2C companies at 4.04%.
2. Involuntary Churn: This type happens without the customer’s intention to leave, usually due to payment issues like expired credit cards or insufficient funds. It’s significant to note that involuntary churn doesn’t reflect dissatisfaction with the product. The churn rate for B2B and B2C companies is almost the same, with B2B having a marginally higher involuntary churn figure due to these payment-related issues.
B2B SaaS Churn Rate Benchmarks & Challenges
In the uncertain economic climate, knowing the natural causes of customer churn should be the ultimate motive of every business. There are several b2b SaaS benchmarks and challenges every business face, and let’s dive into why they occur and what the solutions are.
Churn happens when businesses fail to know users’ behavior patterns.
Personalization is critical for your users to track their preferences, attitudes, and willingness to pay. Amazon, for example, can rely on extensive storage of past purchase decisions to calculate what its user is prepared to pay for specific products. Using advanced analytics, it examines the motives of past purchases—not only a user’s buying history, age, gender, and location but also monetary factors such as purchase value and monthly or yearly shopping expenditure—and then these metrics are used to measure the possibility of a new purchases users are willing to make. This way, you can decide on an accurate price plan, and your users don’t feel an over-pricing factor and do not cancel subscription plans to join your competitors’ service for lower prices.
What do your users actually want?
Personalization is essential because businesses profit from it, and users expect it. The study reveals that 74% of users find mass marketing is frustrating, as many businesses have observed a steep decline in the significance of newsletters, birthday mailings, and matching campaigns.
The users’ expectations grow as they are suggested to more personalized advertising through digital media and other advertising channels.
Paying attention to user behavior patterns can be helpful in making customer retention strategies.
How to track user behavior patterns successfully?
Three factors matter most to a victorious and scalable approach to measure the user behavior pattern: data, triggers, culture, and methods.
1. Getting the correct data (not more data)
A recent survey shows 67% of participants said their biggest challenge was using the right tools to find the right data. Obtaining the correct data is key to knowing best-in-class user behavior patterns, but it can pose a challenge for utilities. One common problem is how to drill down users’ data to stop perceived discrepancies and gaps causing SaaS churn, and so they can know how to generate insights and personalize product promotion campaigns for the better.
The market is swamped with wonderful tools to help retain your customers. Choosing the best tool for your need is an imperative task.
Churnfree is an amazing churn prediction software that has been helping several businesses retain their customers and help them make the best business decisions.
One of its greater benefits is its intelligence and automated metrics that drill down the right data and help you take action on all discrepancies that made the customers leave your products.
It has advanced automated metrics to predict user behavior more correctly and successfully. Metrics such as customer lifetime value (CLV) or upselling probabilities help you make better decisions.
It helps extract relevant external data that might contain a user’s buying power, demographic group, and other characteristics
Builds cancel flow for customers who want to unsubscribe, helping you retain customers.
2. Determining the right triggers for successful user contact
Finding the right time to contact a user is key. That means finding and testing certain events associated with a specific user—a form of trigger-based marketing relatively close to the b2b SaaS business sector.
Models of triggers may contain visits to web stores and webpages, online searches on specific products for price comparisons, and clicks on FAQs about finding a better solutions.
Businesses have to pay a close attention to such triggers. For instance, metrics track a user browsing online about FAQs and clicking on questions about a particular product; it can send the user an automated message promoting its service and a new discounted price plan to enable the user to resume using its services.
3. Using the correct methods and tech to scale up successfully
Many b2b SaaS businesses get caught in pilot mode, running a few effective campaigns but need help running them out across their user base. To scale up, they must take three actions:
Revise their data in real-time and automate their algorithms.
Ensure your system infrastructure is firm and steady.
Create more interfaces for your sales channels.
FAQs
1. What is the typical conversion rate for B2B SaaS companies?
The average lead-to-customer conversion rate for B2B SaaS companies generally ranges from 1% to 5%. Factors such as lead quality and the effectiveness of lead nurturing strategies can influence this rate. A conversion rate exceeding 5% is considered indicative of a highly efficient lead generation and nurturing process.
2. What are the current churn rate benchmarks for SaaS businesses?
For small to medium-sized SaaS businesses, the typical monthly churn rate benchmarks lies between 3% and 7%. This rate is influenced by factors such as the pricing and subscription model, which affect the cost for a customer to switch services.
3. What is an acceptable churn rate for a B2B app’s free plan?
In the context of various industries, the average churn rate for free plans in B2B applications, such as those in Software and Business & Professional Services sectors, is around 3.8%. This contrasts with sectors like Digital Media and Entertainment, Consumer Goods and Retail, and Education, which see an average churn rate of 6.5%.
4. What retention rate should B2B SaaS businesses aim for?
Best-in-class SaaS businesses, irrespective of their size or industry, typically achieve a churn rate of approximately 85-87%. This figure can vary depending on factors like company size and business model, but it serves as a benchmark for exceptional performance in customer retention.
The bottom-line:
Millions business online if not billions, they cant survive without the information of algorithms. The metrics offer the insights that lead you to determine the user behavior patterns. Ensure that you have strong infrastructure to support user retention strategies and B2b SaaS benchmarks. A churn management software like Churnfree helps you understand the bottlenecks coming in your way of building customer retention strategies
